Analysis of chemical shielding
TheoDORE provides functionalities to analyse chemical shielding tensors and, in particular their use to analyze aromaticity.
Visualisation of chemical shielding tensors (VIST)
The VIST method [Eur. J. Org. Chem., (2021)] allows to visualise chemical shielding tensors in the context of the molecular structure showing local variations of the shielding along with its anisotropy. The method proceeds in the following order
Computation of shielding tensors
Interfaces exists for Gaussian, Q-Chem and Turbomole.
Creation of VIST input via
theodore plot_vistRendering of VIST plot in VMD
The tools have only been recently developed and still might require a bit of manual tuning of script files by the user. Any feedback on the user-friendliness of the tools is appreciated.
Command line options
Run theodore plot_vist -h to see all command line options
plot_VIST.py [options] <logfile1> <logfile2>
Command line options:
 -h, -H, --help: print this help
 -v, --vist    : VIST for only these dummy atoms, e.g. -v '0 3 5'
 -o            : Name of output file (for VMD)
 -s, --scale   : Scale factor VIST dumb-bells
 -c, --coor    : Create coordinate files (using cclib)
 -p            : Render and plot all tensors separately
 -l/--lab_min  : Add labels for eigenvalues above this value (in ppm), e.g. -l 10
 -q/--qccode   : Quantum chemistry code (g09, qchem, turbomole)
Simple example
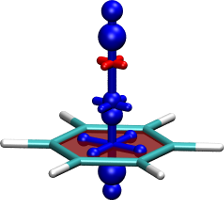
Create a Gaussian input file for an NMR calculation with the positions of the shielding tensors indicated as dummy (Bq) atoms and run Gaussian.
# PBE1PBE/Def2SVP scf=tight nmr

Shielding tensors

0 1
C          0.00000        1.20802        0.69749
C          0.00000        1.20802       -0.69749
C          0.00000       -0.00000       -1.39501
C         -0.00000       -1.20802       -0.69749
C         -0.00000       -1.20802        0.69749
C         -0.00000       -0.00000        1.39501
H          0.00000        2.15464       -1.24395
H         -0.00000        2.15464        1.24395
H         -0.00000       -2.15464       -1.24395
H          0.00000       -0.00000       -2.48803
H         -0.00000       -0.00000        2.48803
H         -0.00000       -2.15464        1.24395
Bq         0.0            0.0            0.0
Bq         1.0            0.0            0.0
Bq         2.0            0.0            0.0
After the job finishes simply run (assuming you named the output file gaussian.log)
plot_VIST.py gaussian.log
Open a molecular coordinate file in VMD. Then from inside VMD click: File - Load Visualization State - VIST.vmd
In the first instance, this will plot the shielding tensors of all Bq positions on top of each other.
Use, the -p option to plot them all individually or use the -v option to select individual tensors.
Processing several output files
In many cases, it is desirable to process several output files at the same time to produce a consistent representation of several output files, for example to represent the shielding in different electronic states. The following figures represent the shielding in the dication, neutral state, and dianion of a macrocycle.
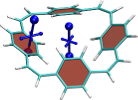
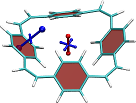
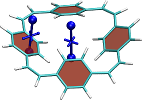
This figure was created with the command
theodore plot_vist -c -v '0 4' */gaussian.log
The -c option specifies that the molecular coordinates are directly parsed from the log-file. -v 0 4 indicates that only the Bq atoms with index 0 and 4 are included in the representation. */gaussian.log indicates that the gaussian.log files in all subdirectories are processed.
The files are loaded into VMD via
vmd -e VIST.vmd
Initially all geometries are superposed on top of each other. To hide some of the molecules use the D option (part of T A D F Molecule) in the VMD Main menu.